

by Patrick Burns.
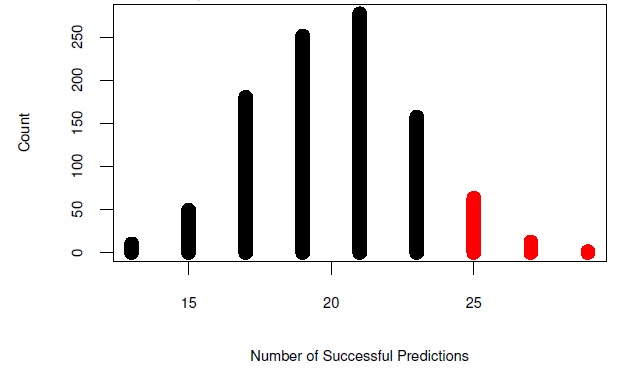
Abstract: The quality of stock market predictions based on the winner of the Super Bowl is examined using permutation tests. These tests are very easy to perform in modern computing environments like the R language. One key point that comes to light is that the success rate of a prediction is not a good measure of its usefulness. Statistically significant success in prediction does not automatically lead to economically profitable strategies.
This version: 2004 January 02 (pdf)
Associated software is in the BurStMisc R package and updated data is available via ”The US market will absolutely positively definitely go up in 2012”.
jun 25, 26
The email address patrick@burns-stat.com was out of action for a few hours today. It is back now.
jun 25, 26
Customization in R. Basics Several features benefit from being customizable — either because of personal taste or specifics of the environment. The way R implements this flexibility is through the [...]
jun 25, 26
How to control the limits of data values in R plots. R has multiple graphics engines. Here we will talk about the base graphics and the ggplot2 package. We’ll create [...]